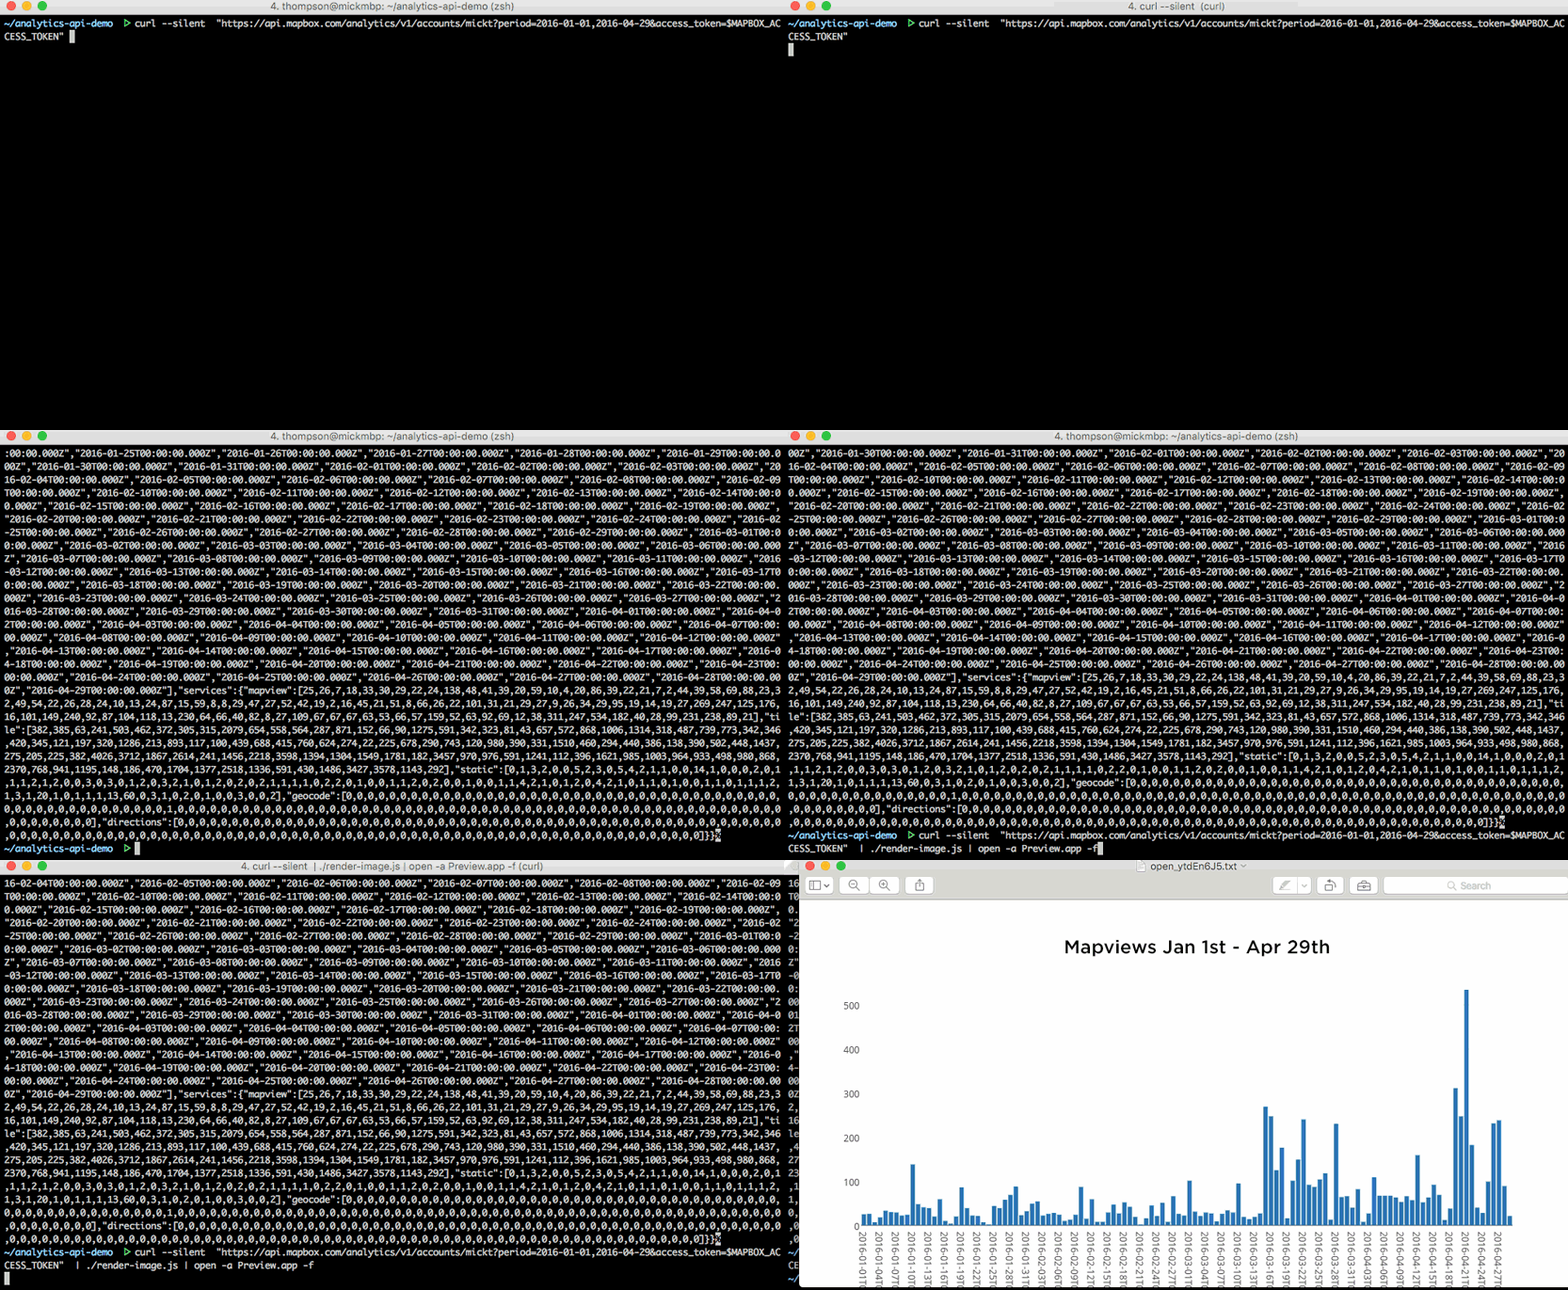
When you invite APIs into your stack, they become part of the infrastructure your code is built upon. This is especially true when the API is the beer, as it is for the API comparisons on EveryDeveloper. Yet, since the API is a service someone else runs, you have far less control over it than the rest of your code. When a billing, usage, or pricing endpoint is provided, it helps you keep a closer eye on this auxiliary piece of infrastructure.

MapBox released API analytics, which makes map view and other usage data available programmatically. The animation above shows how you could plot the values in a chart, but you could also build alerts or email reports from the data. You could save yourself, or your team, from logging into the MapBox dashboard.
Over three years ago Twilio added usage records to its API. VentureBeat called it “what devs have been waiting for.”
What do you think? Is it?
MapBox and Twilio are among the great APIs with one thing in common, but that doesn’t mean we have to like everything they do.
Meta-features like billing are more table than beer, meaning they support the service rather than are the service. Certainly, the more committed to a platform, the more likely you are to integrate usage data (in fact, MapBox only provides it at the top two tiers). I think it’s a sign of a mature infrastructure API, but does the feature alone make you more interested in the service?
Let me know on Twitter or send me a message. I’ll incorporate your feedback into future research.
